


5.5.2.2 Regional-scale changes
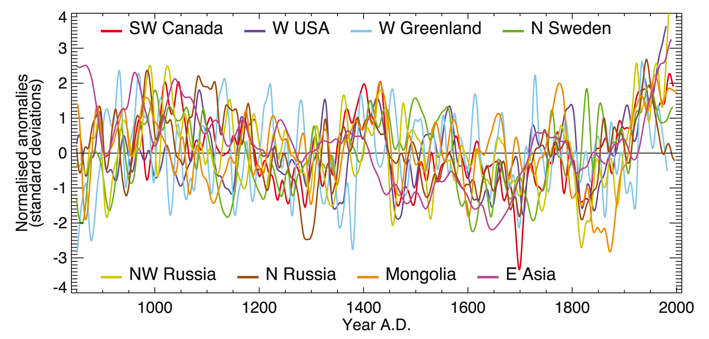
Although the forcings in the last millennium have relatively small amplitudes, they have played a dominant role in the changes in the temperature on a hemispheric scale (Fig. 5.27). By contrast, on a regional scale, changes in the oceanic or atmospheric circulation can completely mask the influence of the forcing in some periods. As a consequence, the Medieval Warm Period and the Little Ice Age can by no means be considered as globally or even nearly globally synchronous phenomena. This is the reason some climatologists avoid using these terms. The temperature in the first part of the second millennium was generally higher than in the period 1500-1900 but warm and cold periods occurred at different times in different locations (e.g. Fig. 5.28).
|
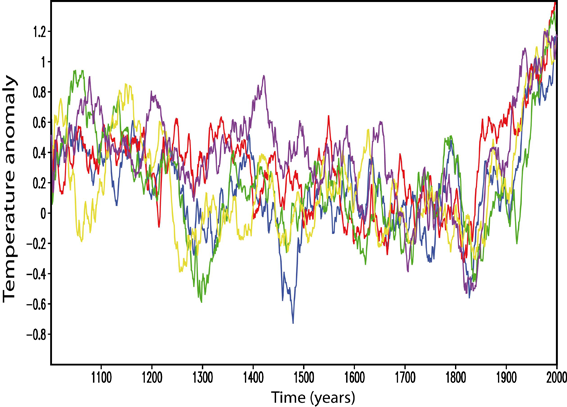
Analysing the sources of climate variations on a regional scale is extremely complex because some changes in the circulation can be part of the response of the climate system to the forcing. This was briefly described in section 5.5.2.1 where the tendency towards a positive NAO index in the winter following a major volcanic eruption was mentioned. It is thus very hard to disentangle the response of the circulation to the forcing from the internal variability that would be present in the absence of any forcing change. Nevertheless, a significant part of the climate variability on a regional scale in the last millennium is probably related to this internal variability, which is associated with the chaotic nature of the climate system and is thus similar to the daily changes in the weather. This can be illustrated by performing ensemble of experiments using a climate model. For figure 5.29, five simulations have been run with exactly the same forcing but slightly different initial conditions. Because of those small differences, and of the sensitivity of the climate system to initial conditions, each simulation reproduces a different realisation of the internal variability of the modelled system (note that the observed climate also corresponds to one realisation of the internal variability of the real system among all the possibilities). While the response to the forcing is nearly identical resulting in some common characteristics for all the simulations, the large differences between the five experiments indicate that the internal variability can be the dominant source of climate changes before the 20th century.
|