| Home | Curriculum Vitae | Research & Publications | Recent News |
Recent News
Floods in Belgium (July 2021)
Seminar on future climate extremes (ASALV, May 2021)
EGU Arne Richter Award for Outstanding Early Career Scientist
On the 2020 climate events
Review of the 2020 climate year (December 2020)
Impact of the 2020 pandemics, climate ambitions and trajectories (December 2020)
On the September 2020 heatwave over Belgium (September 2020)
Comparison of the climate and covid-19 pandemics (July 2020)
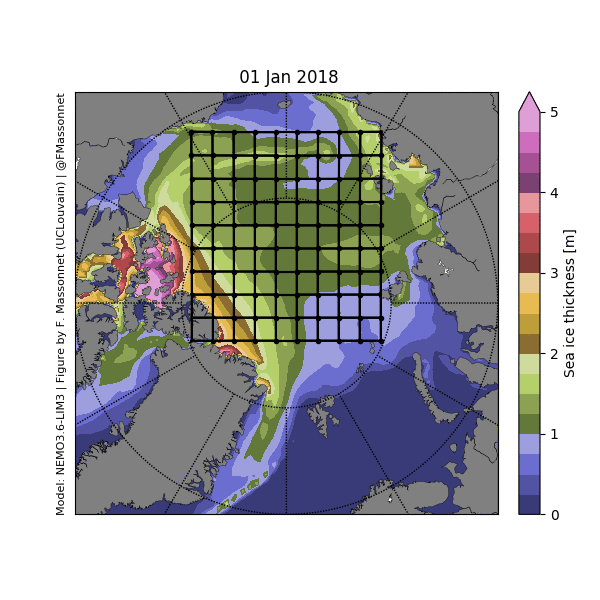
Animation: one year of Arctic sea ice as simulated by a numerical model (February 2019)
![]()
Invited at the program "Les Éclaireurs" (December 2018)
Belgium's French-speaking public service channel puts the light on three researchers each week:
Invited EDF Luminus All Employee Meeting for insights on climate changes (November 2018)
F.R.S. - FNRS Research Associate (October 2018)
On October 1st, I was officially appointed Research Associate of the FNRS, a position that allows me continuing my research on seasonal to decadal climate prediction. You can find more details on my research project here:
UCL interview (French): https://uclouvain.be/fr/sciencetoday/actualites/prevoir-la-meteo-au-dela-de-quelques-jours.html
FNRS interview:

Interview at the national TV (La Une) on the 2018 summer heat wave (July 2018)
Interview at the national radio (La Première) on sea level rise (February 2018)
Interview at the national news TV (RTBF) on the navigability of the Arctic Ocean (February 2018).
Interview by the newspaper Le Soir on the anomalous "Cold Europe/Warm Arctic" configuration (February 2018)
The SIPN South project is on track! (November 2016)
I am leading the SIPN South project (http://acecrc.org.au/sipn-south/) that aims at better understanding the skill and value of environmental forecasts in the Southern Ocean.
![]()
Interview at the national news TV (RTBF) on the 2016 record in global mean temperature.
Interview at the national TV (RTBF) on climate monitoring of the world Oceans (October 2016)
Interview by De Morgen (November 2015) on a year of records

(also at : https://www.demorgen.be/wetenschap/het-bewijs-is-er-extreem-weer-wordt-veroorzaakt-door-de-mens-b3339dd5/)
Was 2014 an extreme year? (June 2015)
Look at my guest post contribution on Ed Hawkins's Climate Lab Book.
The Arctic sea ice Outlook June report is out (June 2015)
31 groups worldwide participated to this effort. Look at the executive summary and my contribution here.
Video of my public doctoral thesis defense
The Arctic sea ice Outlook June report is out (June 2014)
28 groups worldwide participated in the Arctic sea ice outlook this year. The aim of the experiment is to predict pan-Arctic and regional sea ice conditions in September 2014.
The report can be found here. Together with my colleagues Antoine Barthélemy, Thierry Fichefet and Hugues Goosse, I participated for the second time in this experiment. Our predictions are obtained from ocean--sea ice simulations driven by atmospheric reanalyses. Below is a figure showing the predicted evolution of 2014 Arctic sea ice extent, and the bias-corrected estimate of sea ice extent. You can find more about our participation here.
I am now a Doctor! (April 2014)
I defended my PhD thesis, entitled "Evaluation and improvement of climate simulations of sea ice" this Friday 25th of April 2014.
You can find the PDF of the thesis here.
You can find a video of some parts of the presentation here (in French).
You can find the slides of the presentation (in French) here.
You can find a summary of the thesis here. (French: here).

My thesis dealt with the joint use of models and observations to better reconstruct the sea ice state, or predict its future evolution
Sea ice data assimilation in a nutshell (April 2014)
(Video recorded at the occasion of the SIPN Workshop in Boulder, CO, 2-4 April 2014). Link not working? Try here.
Sea ice data assimilation in one minute (March 2014)
(Video recorded at the occasion of the IGS meeting in Hobart, 10-14 March 2014). Link not working? Try here.
Interview in Metro on Northern Hemisphere cold waves (February 2014)
Southern Ocean sea ice reanalysis (October 2013)
We produced a multidecadal reconstruction of sea ice in the Southern Ocean (Massonnet et al., 2013).
The data is public and can be retrieved from here.
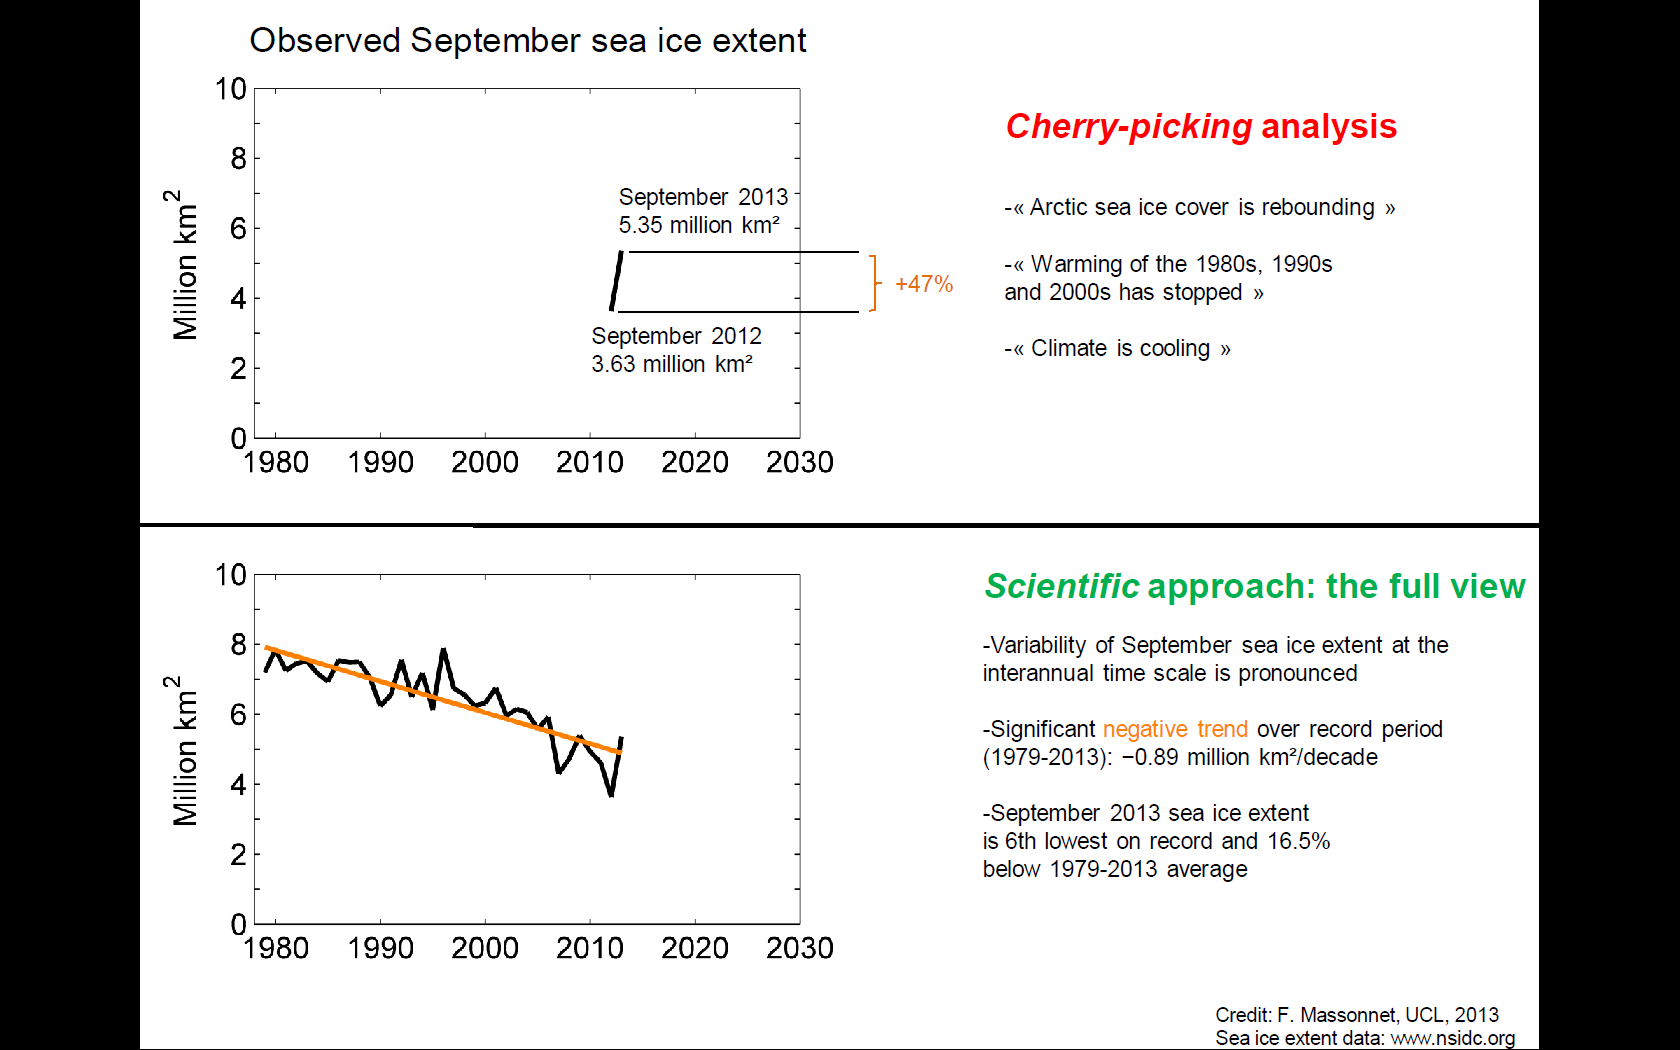
Biased and objective interpretations of September 2013 Arctic sea ice extent (October 2013)
Sea ice data reanalysis available! (May 2013)
Sea ice area, extent and volume from the NEMO-LIM2 ocean-sea ice model with data assimilation of observed sea ice concentration are now available.
The data is in text format. Sea ice area/extent are in 10^6 km² ; sea ice volume is in 10^3 km³.
Citation: F. Massonnet,P. Mathiot, T. Fichefet, H. Goosse, C. König Beatty, M. Vancoppenolle, T. Lavergne, A model reconstruction of the Antarctic sea ice thickness and volume changes over 1980-2008 using data assimilation, Ocean Modelling, 64 67-75, doi:10.1016/j.ocemod.2013.01.003
For more data, you can send me an e-mail or have a look at this README
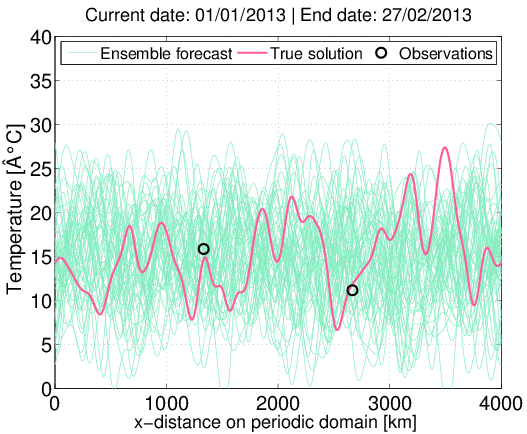
Visualisation of the EnKF (April 2013)
In the animation below, I estimate a state-vector subject to linear advection on a periodic domain. This example was proposed by G. Evensen in his reference book. I think it is a great insightful gate to understand the basic principles of (ensemble) statistical filtering.
The problem: Suppose we would like to estimate some physical property transported in a flow. For example, we may want to estimate the air temperature at ground level on the 50°N latitude circle (Brussels). In our simplistic example, temperature is simply advected eastward with a constant velocity of 1 m/s. For our purposes, we will assume no thermodynamic processes at stake, so that the problem is that of pure advection. Can we accurately estimate the temperature profile at our latitude band?
The exact solution is displayed as the red curve, but is hidden to us. One piece of information comes from sparse measurements at two distant stations. Two such measurements are available every ~2.5 day (every 5th time step), and the variance of the error of measurement is estimated to be 1°C² (the two distant measurement errors are supposed to be independent).
One approximate solution is to start from an ensemble (here, 50 members) of likely profiles of temperature. We have a priori no idea about the shape of those profiles, so we will sample them from a mean of 20°C with an assumed decorrelation length scale of 80 km (the domain length is 4000 km). This ensemble of first guess (green lines) is advected in space, and updated whenever observations are available. Because the error covariance matrix of the ensemble forecasts has some extra-diagonal structure, the correction of the forecast is active in the neighborood of observations (black dots).
Note that the example below is purely fictitious and is not related to the real temperature profile around the Earth!
Olivier back from Antarctica (November 2012)
CMIP5 Arctic sea ice (March 2012)
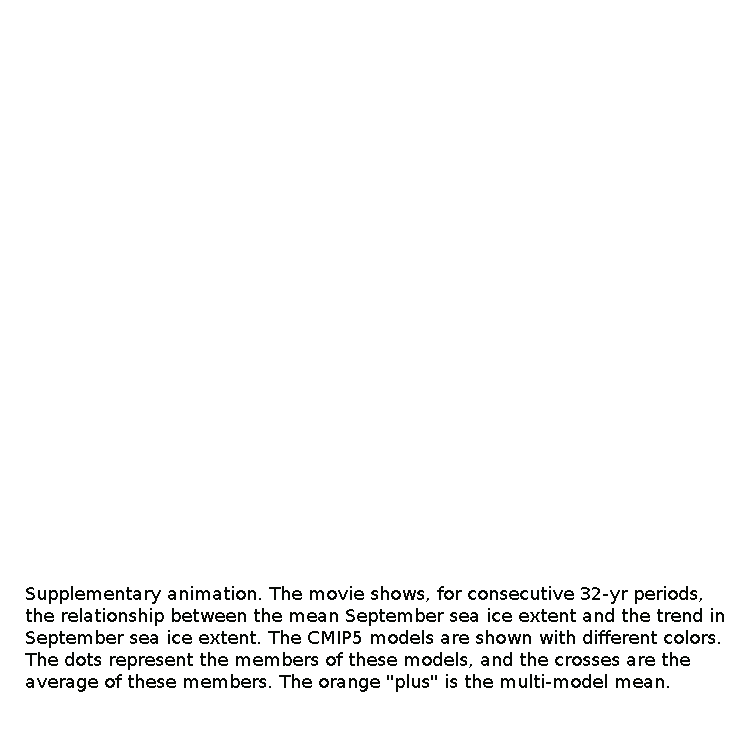 |
The animation on the left shows the simulated relationship, over consecutive 32-yr periods between 1979 and 2100, between the mean September Arctic sea ice extent and the trend of the sea ice extent over the same period.
Each colored cross corresponds to a climate model participating to the Coupled Model Intercomparison Project, phase 5 (CMIP5)
The dots are members of the same model. The Orange plus is the multi model mean. |
This animation shows that the CMIP5 models follow resembling trajectories towards summer ice-free conditions, although they start with very different mean September sea ice extents. Their summer sea ice decline (represented in the figure as the trend, y-axis), is indeed reaching particularly low values when the mean September sea ice extent(x-axis) is at ~2-4 million km². This nonlinear relationship is important as it stresses the need to start from a reasonable September sea ice extent, in order to correctly anticipate the timing of possible ice-free conditions in summer in the Arctic.
Want to know more? See Research > Peer-reviewed publications
Interview at the national TV (RTL-TVI) on Arctic sea ice melt (November 2011)
LIM Outputs on Google Earth!
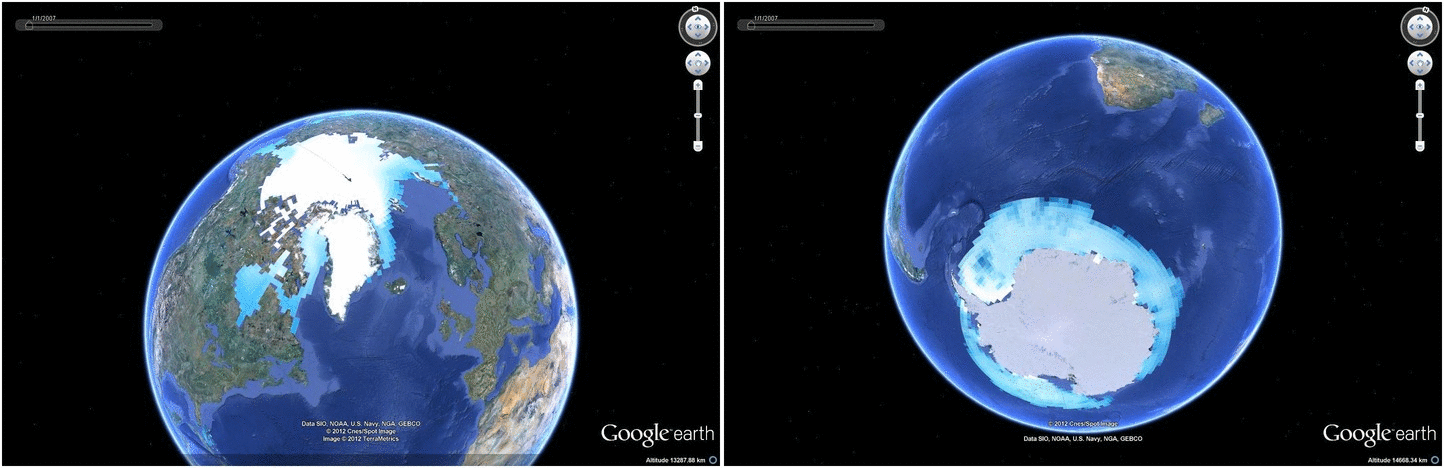 |
The LIM3 (Louvain-la-Neuve sea Ice Model, version 3) outputs are now visualizable with Google Earth!
The animation shows the wax and wane of Arctic (left) and Antarctic (right) sea ice during the year 2007, as simulated by LIM3. White areas indicate thick ice and blue areas thin ice. Note that sea ice in the Northern Hemisphere reaches its maximal coverage when that of the Southern Hemisphere reaches its lowest coverage, and vice-versa.
Want to know more about LIM? Go here !